Navigate toolbar: [ Diets | Photos | Estuarine | FADs | Soniferous | CV | Home Page ]
Rountree, R.A., F.S. Scharf, and Francis Juanes. The effect of prey body type on its running the predator gauntlet through ontogeny: is bigger better? Marine Ecology Progress Series
Summary
. The effect of prey body type on predator-prey size relationships is explored. Specifically, the prey and predator sizes at which a size refuge is achieved are compared among body prey body types. Significant differences in the size refuge and the rate at which the size refuge is achieved are found among fish body types (e.g. fusiform, eel-like, compressiform, depressiform, etc.). Implications for the "bigger-is-better" hypothesis are discussed. This paper is based on analysis split off from the Scharf et al. 2000. Whereas that paper explored the predator-prey size relationships from the predator's perspective, this paper takes the prey's perspective.
The following series of figures are working drafts constructed during the analyses upon which the paper is based. They are not the actual figures for the paper.
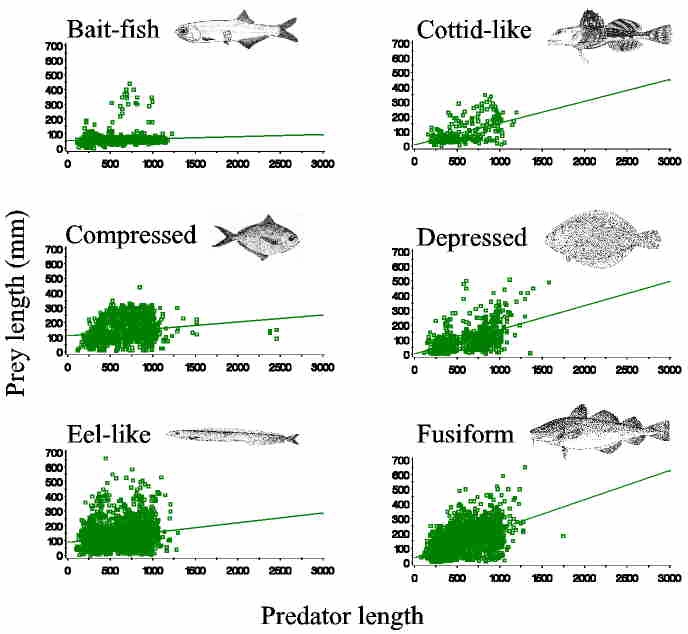
Figure 1. Plot of prey length by predator length for prey fish species pooled into similar body types. Data are pooled over all predator species.
Figure 2. Regression of prey to predator size ratio against predator size for each prey body type. Note that in all cases, the relationship is negative.
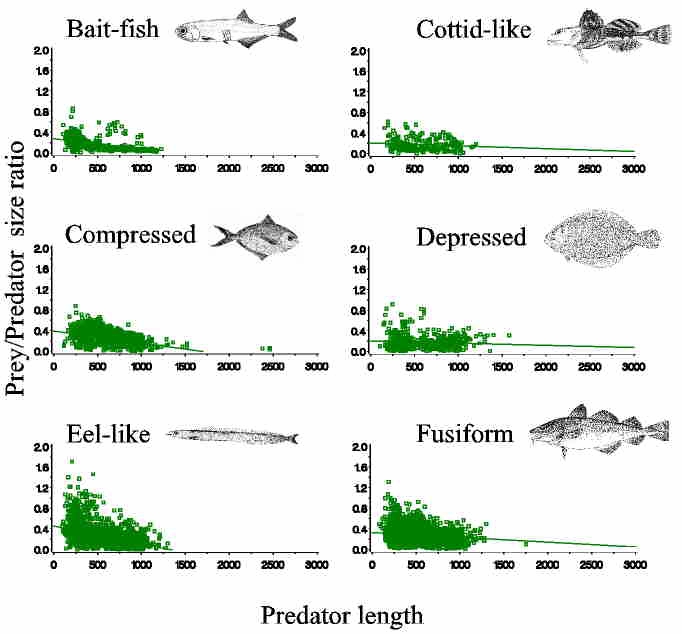
Figure 3. Regression of the coefficient of variation of predator lengths against prey length. Note the strong negative relationships. Supporting the "Bigger is Better" hypothesis. Note differences among prey body types, suggesting the importance of a consideration of prey body type on studies of predator-prey size relationships.
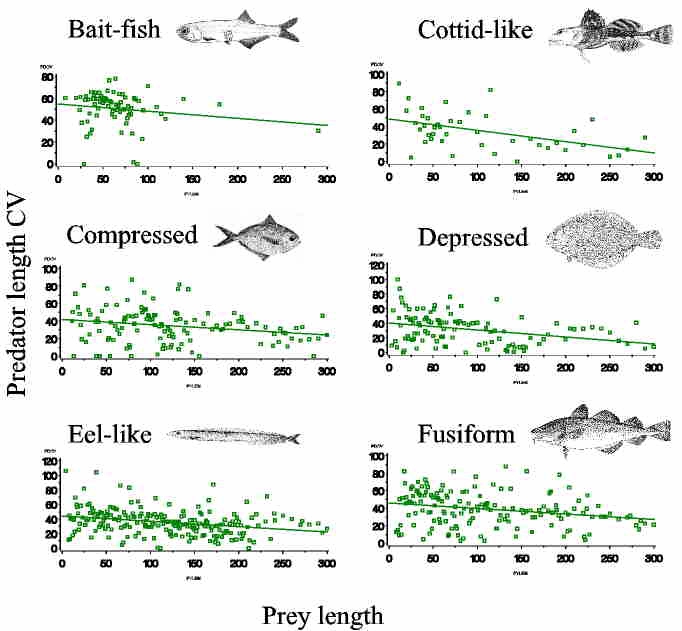
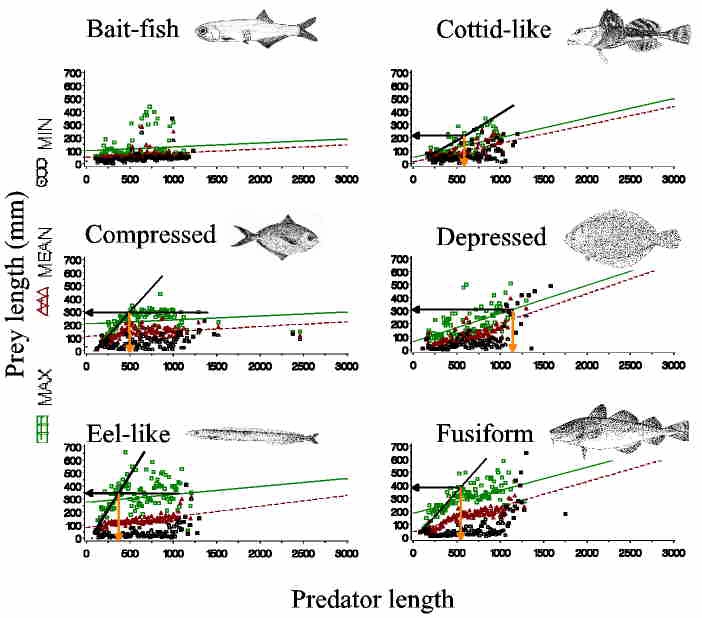
Figure 4. Regressions of the minimum, mean and maximum prey size on predator size (prey size statistics computed for each 1-cm size class of predators. Note that the maximum prey size per 1-cm predator size tends to increase rapidly and then level off (particularly evident for compressed prey). We suggest that these analyses indicate differences in the onset of the predator size refuge (if achieved). Three important parameters are indicated: 1) size of prey at its size refuge (or availability to predators), 2) size of predator at the prey's size refuge, and 3) rate at which the size refuge is achieved (slope of regression to the size refuge, excluding other data).
We are currently summarizing these statistics and are exploring alternative methods to quantify the relationships (e.g., non-linear regression and quantile regression).
Running the predator gauntlet
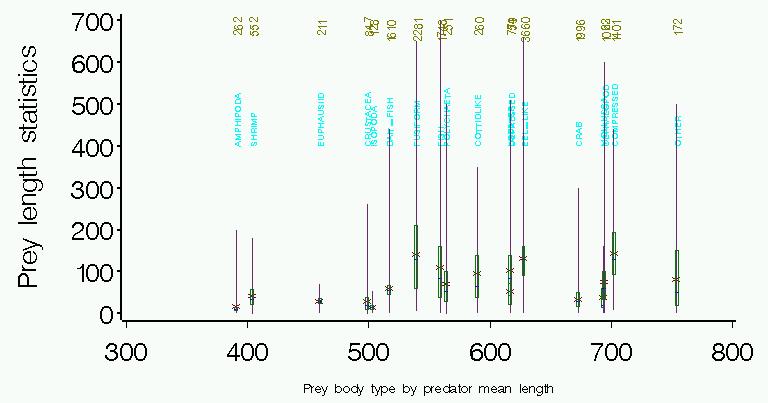
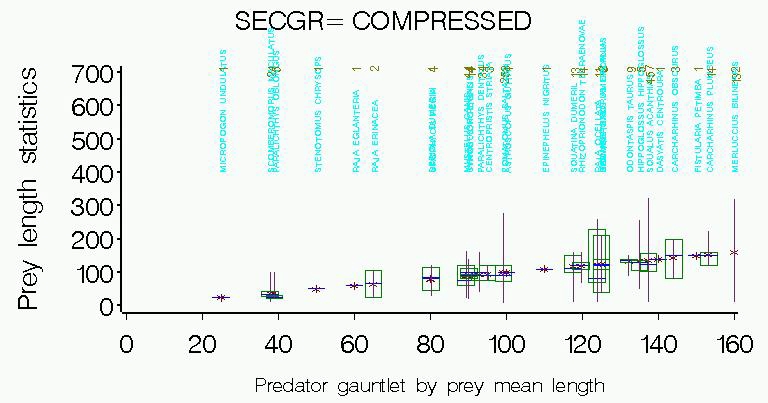
:The following series of figures show box plots of either predator or prey length statistics. The vertical line represents the range, the box represents the range between Q1 and Q3, the horizontal line is the median and the x is the mean.
Figure 5. Box plots of prey length statistics for prey grouped into major invertebrate taxa and fish body types. Prey groups are ordered along the x-axis by mean prey size.
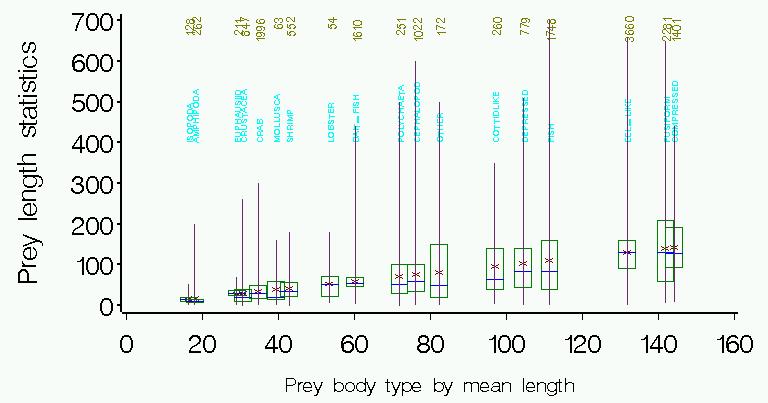
Figure 6. Box plot of predator length statistics for each prey group. Prey groups are ordered by the mean prey length in the group.
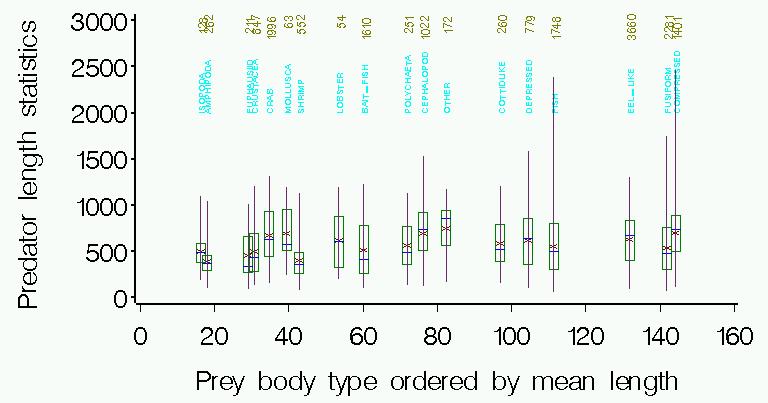
Figure 7. Box plot of predator length statistics by prey group. Prey groups are ordered by the mean predator size for that group.
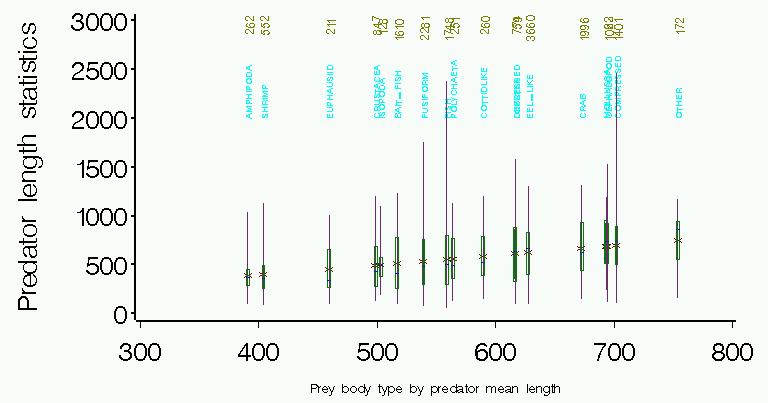
Figure 8. Box plot of prey length statistics for each prey group. Prey groups are ordered by the mean predator length for that prey group.
The next series of figures are similar to the above, but illustrate the predator species for each prey group.
Figure. 9. Predators of isopods.
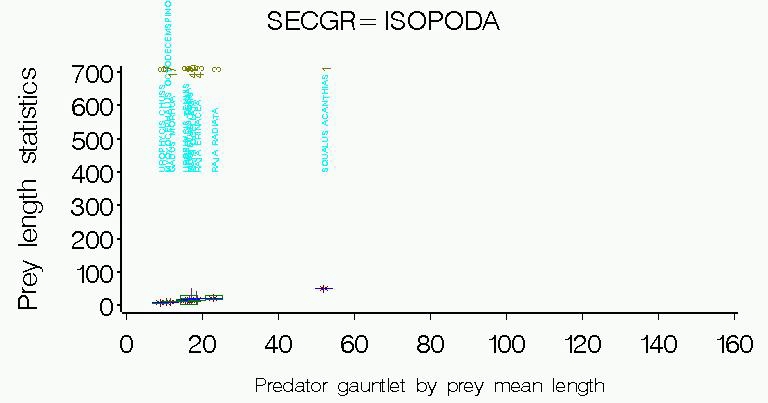
Fig. 10. Predators of amphipods.
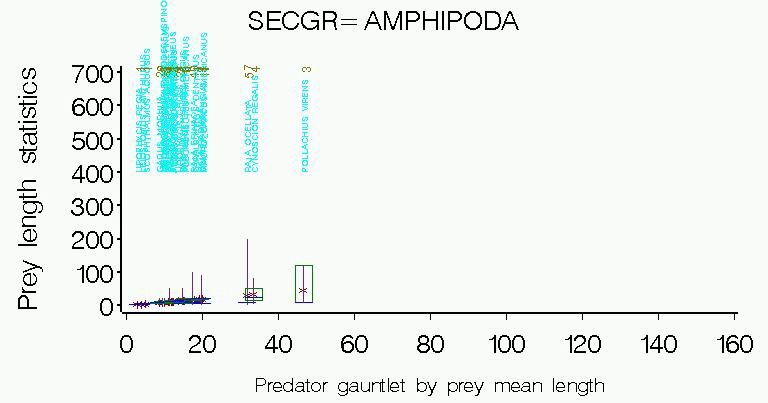
Figure. 11. Predator of euphausiids.
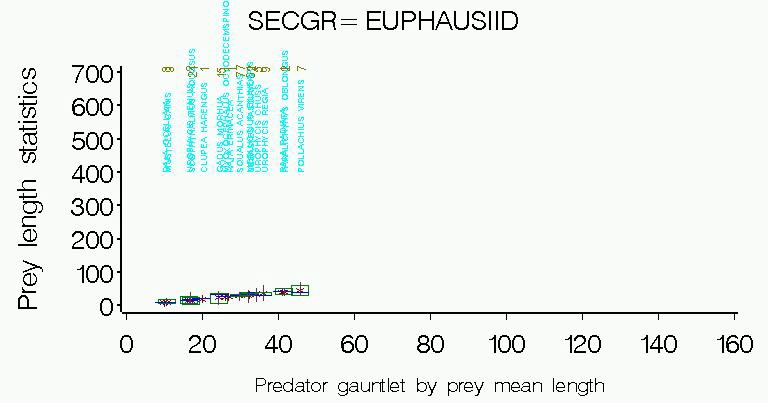
Figure 12. Predators of crabs.
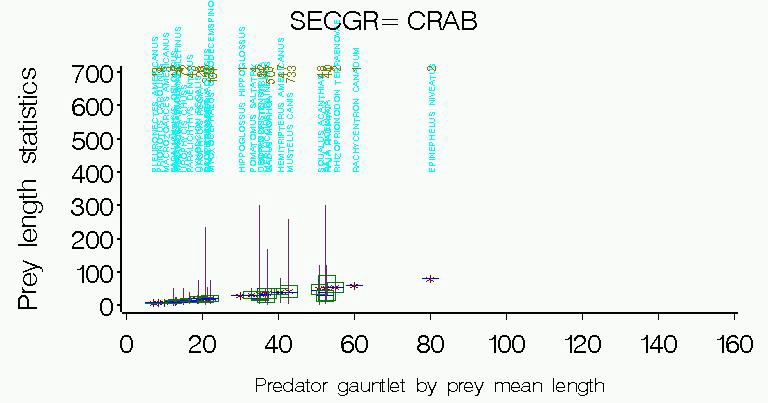
Figure 13. Predators of shrimp.
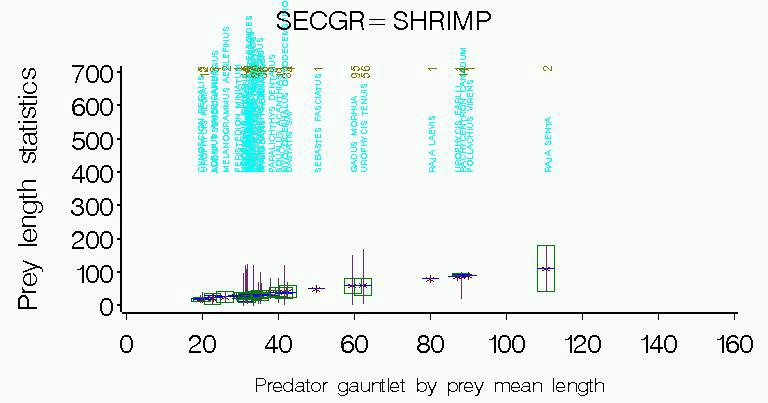
Figure 14. Predators of lobster-like crustaceans.
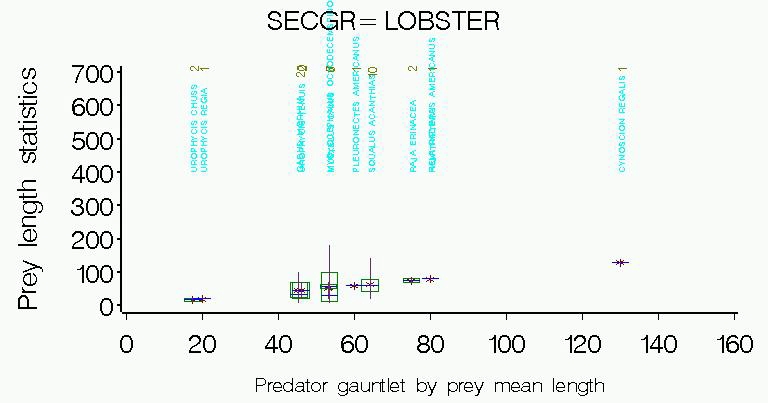
Figure 15. Predators of polychaets.
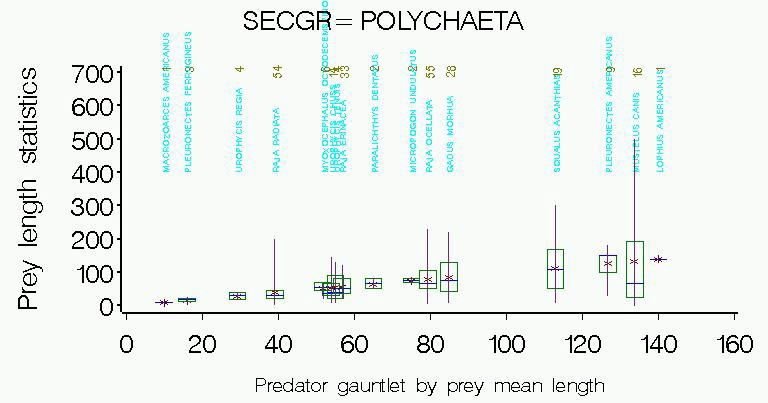
Figure 16. Predators of cephalopods.
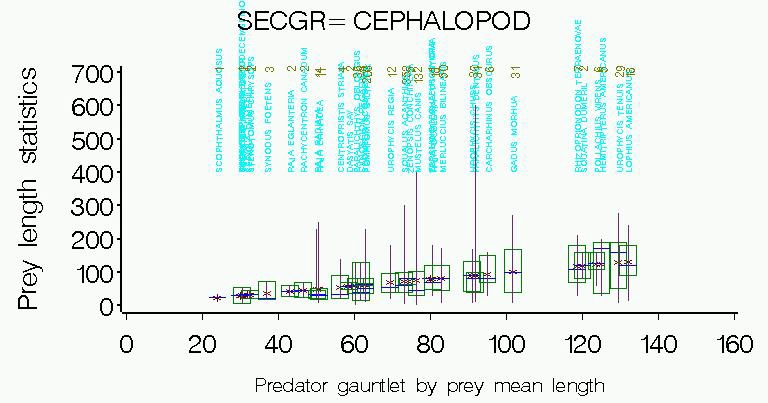
Figure 17. Predators of small "bait-fish" (plan to re-assign member species to other body types).
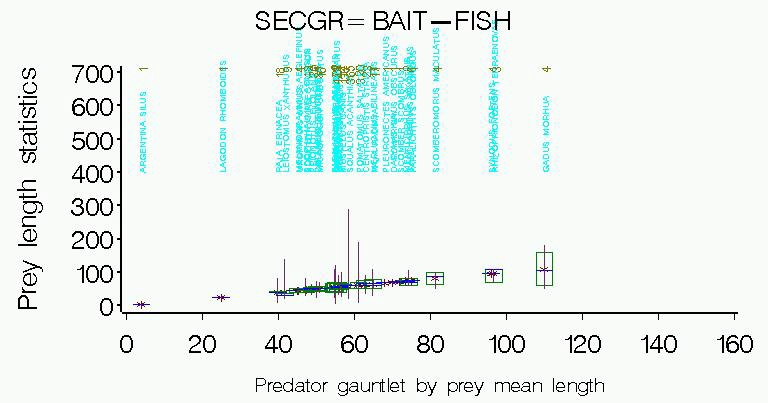
Figure 18. Predators of "cottid-like" fish (e.g., mainly searobins and sculpins).
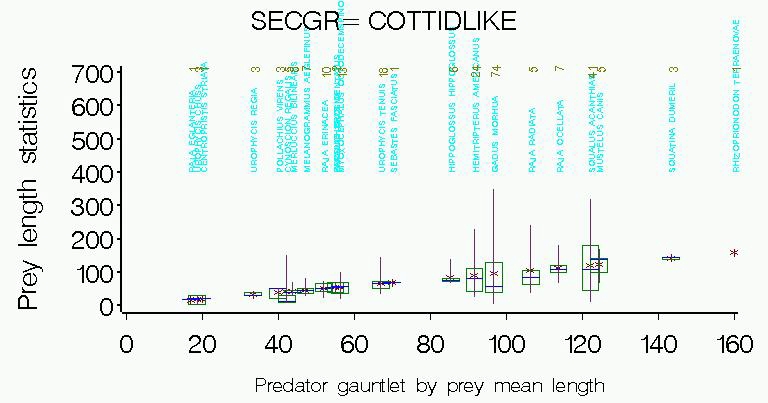
Figure 19. Predators of depressed fish (actually includes the compressed flatfishes which are functionally more similar to the depressed fishes than other compressed forms).
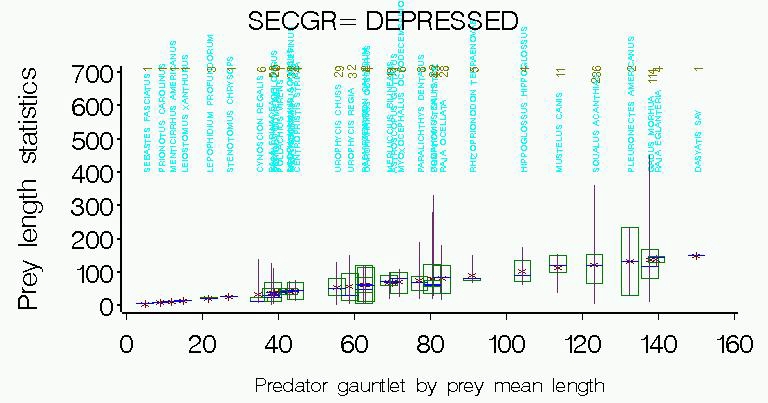
Figure 20. Predators of eel-like fishes (includes true eels, cusk-eels, pipefish, and sandlance).
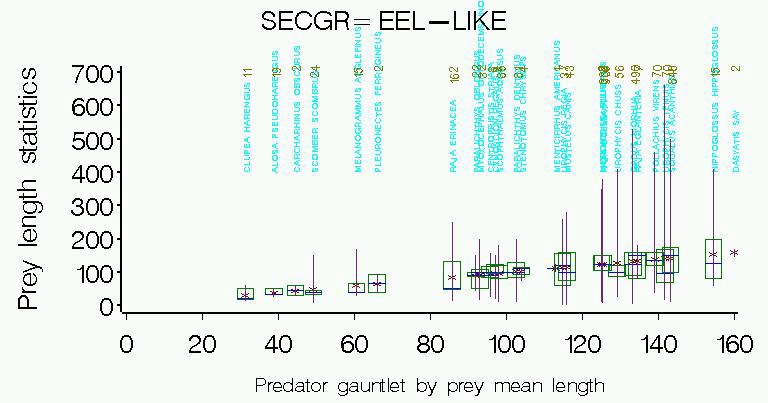
Figure 21. Predators of fusiform fish.
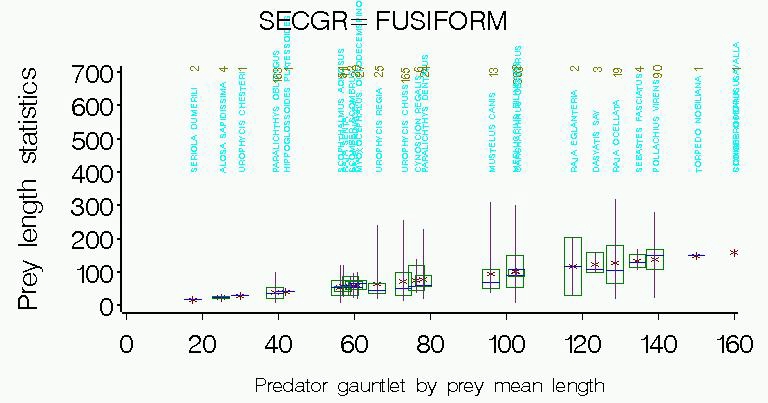
Figure 22. Predators of compressed fish.
Below are some examples of specific predator-prey size relationships.
I.
Scatter plots of prey by predator lengths.All predators for prey species:
Sand lance (compare with box plot)
Atlantic rock crab (compare with box plot)
Unidentified engraulids (compare with box plot)
Unidentified fish (compare with box plot)
Silver hake (compare with box plot and mean plots)
Spiny dogfish predators on:
II.
Scatter plots of mean prey length (vertical bars are 1 standard error from prey mean) by mean predator length (horizontal bars are 1 standard error from predator mean).All predators of silver hake (compare with scatter and box plot)
III.
Box plots provide prey length statistics (mean, median, q1,q3, min and max) for all predators. Ignore the numeric labeling on the horizontal axis, as it's an arbitrary code. Numbers above the predator names are sample sizes for that prey/predator combination.All prey types pooled (ordered by predator maximum size)
All prey types pooled (ordered by predator phylogeny)
All predators of a given prey:
Sand lance (compare with scatter plot )
Atlantic rock crab (compare with scatter plots)
Unidentified Gadids (cods and hakes)
Unidentified engraulids (anchovies) (compare with scatter plot)
Unidentified fish (compare with scatter plot)
Silver hake (compare with scatter plot and mean plots
Unidentified Ophidids (cusk-eels)
This page was last modified on July 20, 2001
Copyright © 1999 by Rodney Rountree. All rights reserved
Navigate to main diet pages: [ Parent | Summary | Fluke | GMDiet | GMGuild | Goosefish | Guild | Ontogenetic | Prey size | Structure ]
Navigate to main pages: [ Diets | Photos | Estuarine | FADs | Soniferous | CV | Home Page ]