FISH PREDATOR GUILDS FOR GEORGES BANK BASED ON FOOD HABITS DATA COLLECTED DURING NEFSC BOTTOM TRAWL SURVEYS FROM 1981-90.
Rodney A. Rountree (NMFS, Northeast Fisheries Science Center, 166 Water St., Woods Hole, MA 02543; U.S.A. 508-495-2340; rrountre@whsun1.wh.whoi.edu)
Food habits data collected on Northeast Fisheries Science Center groundfish surveys between 1981 and 1990 were analyzed to categorize abundant fish species into feeding guilds. Fishes examined included several species of Gadids, Pleuronectids, and elasmobranchs. To take into account expected large ontogenetic changes in diet, each species was divided into 10 cm size classes, which were analyzed separately. Most species clustered into two or more distinct intra-specific groups based on size, supporting the concept of "ecological species". Predator guilds bore little relation to taxonomic grouping, but were strongly influenced by predator size, habitat (pelagic, semi-pelagic, and benthic), extent of piscivory, and prey size. The identification of predator guilds on Georges Bank, is an important first step in ongoing studies of competitive interactions among fishes in the Georges Bank groundfish community. (Georges Banks, guilds, prey suites, predator-prey, food habits).
Introduction
There is a lot of interest at the NEFSC to develop multi species population models for N.W. Atlantic stocks, particularly for Georges Bank, which has sustained one of the worlds largest fisheries since colonial times. Historic changes in these fisheries, such as switching to alternate species as populations are exhausted, have undoubtedly had profound impacts on groundfish communities. For example, over the last fifty years stocks of traditional gadid and pleuronectid species such as Haddock, Atlantic cod, Yellowtail Flounder and American Plaice, have plummeted, while stocks of elasmobranchs (primarily skates and the spiny dogfish) have climbed to record levels. In fact, there has been a sharp shift from a gadid to an elasmobranch dominated community on Georges Bank. This shift has raised concerns that the abundant elasmobranchs may inhibit recovery of gadid stocks, even after fish mortality is reduced.
Key components to development of the multi species models are parameters that describe predator-prey and competitive interactions. Therefore, there has been a renewed interest in the food habits data that the Food Chain Dynamics Investigation has collected in conjunction with the Bottom Trawl Survey over the last 3 1/2 decades.
This poster summaries my preliminary efforts to identify fish feeding guilds based on NEFSC food habits data. A guild is a group of species (and I would add life history stages) that share a common resource and, thus, occupy closely related or overlapping niches. The identification of apparent guilds of fishes is an important first step towards more focused studies of competitive interactions among fishes in a community.
Methods
- Study area and data source
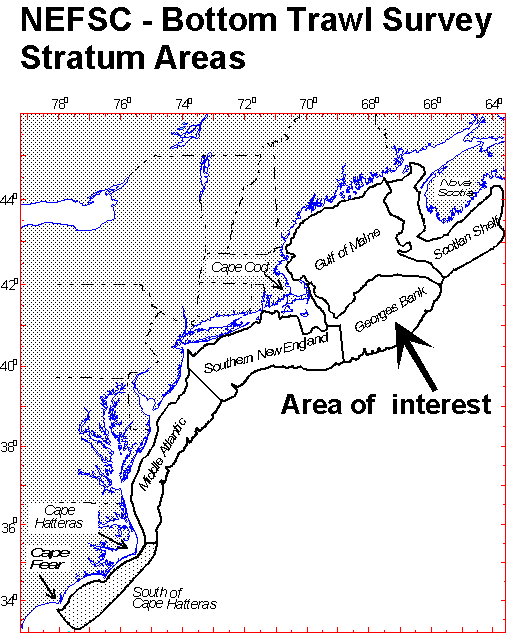
The food habits data is derived from a long time series of area stratified Bottom Trawl Surveys which are designed to provide broad scale population level data. Qualitative food habits data collections began in 1963, and quantitative sampling began in 1973. Food habits data are collected from each trawl using a length-stratified sampling design. From 1973-90 over 130,000 stomachs from about 9,200 trawl tows out of 13,000 tows have been collected. About 20 species make up the bulk of the data, but some samples are present for about 180 species.
This report focuses on food habits data collected from spring Bottom Trawl Surveys on Georges Bank during 1981-90. The analyses are restricted to the fifteen most frequently sampled predator species for which over 10,000 stomach samples were taken from 530 trawl tows.
- Data analysis
I used cluster and PCA analyses as tools to identify potential feeding guilds on Georges Bank during the Spring, based on the diet composition of the fifteen species. However, because I was interested in possible differences in guild position among different life stages of a given species, I arbitrarily divided all fifteen species into 10 cm length classes. To conduct the multivariate analyses, then, I first had to determine the diet composition of 71 predator groups (15 species x 2 to 14 length classes). Weighted mean stomach volumes for each of 104 prey categories were calculated. Catch at length data was used to weight the samples to account for within tow correlations in a two stage cluster sampling design. The weighted mean volumes were then converted to relative means, and arcsine-transformed prior to input into the multivariate analyses.
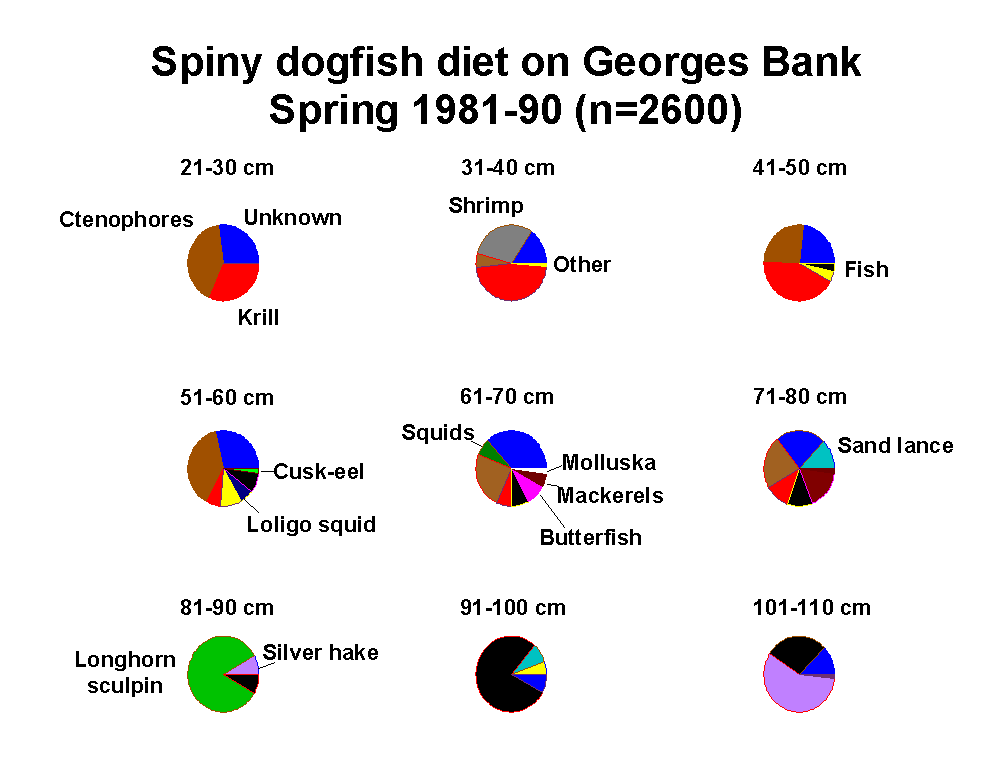
An example of the data used in the multivariate analyses (prior to transformation) is shown here for spiny dogfish - Squalus acanthias. There were nine 10-cm length classes for spiny dogfish which are shown from smallest to largest (reading from the upper left to lower right). Note that only new prey are labeled for each pie reading along the progression of pies from smallest to largest size classes. Looking at the first row, the smallest size classes feed primarily on gelatinous zooplankton and krill. In the middle row, pelagic fish and squid become increasingly important. The largest fish feed predominantly on demersal and benthic fishes.
Cluster Analysis
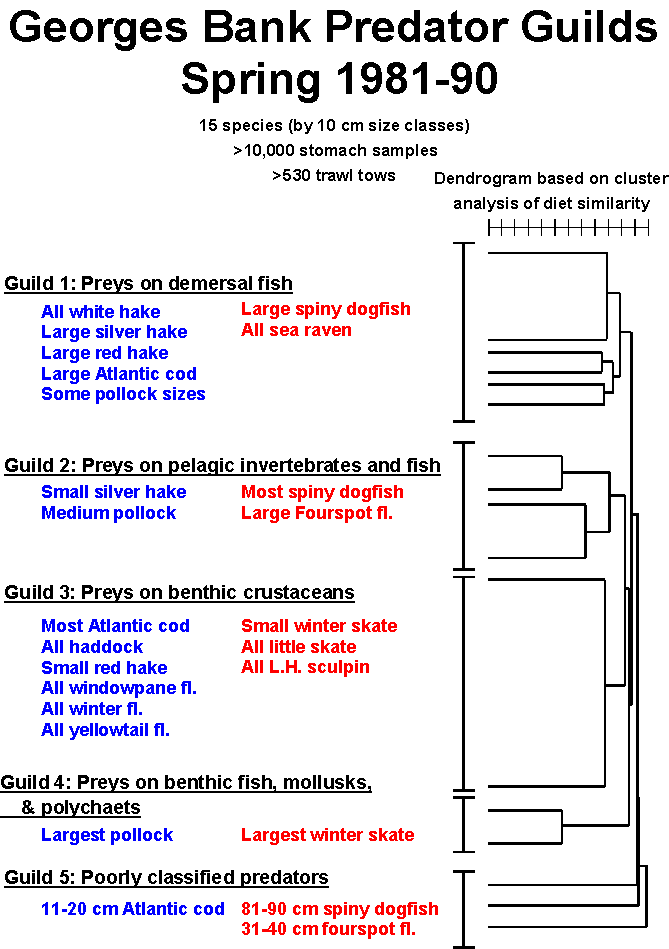
This is a simplified dendrogram resulting from cluster analysis based on 10,000 stomachs from 530 trawl tows conducted during the spring Bottom Trawl Survey on Georges Bank from 1981-90. Fifteen predator species with 2-14 length classes (71 ecological species), and 104 prey categories were input into the analysis. The species fall into three major groups, with group 2 further divided into 3 sub-groups (see Appendix A. for the full dendrogram and "blow-ups" of each group). Each of these five groups can be interpreted to suggest five species guilds. Species within each guild are considered potential competitors for food. Commercially important species are shaded blue, while under-utilized (until recently) or non-commercial species are shaded in red. For clarity all size classes of a species which fall into the same cluster group are reflected in the species label. For example, only the largest size classes of spiny dogfish, but all size classes of white hake, fall into guild 1. Details on the exact cluster pattern for all size classes and species are given in Appendix A.
There are two important inferences which can be drawn from this analysis. First, is the obvious inference of potential competition among members of the same guild. The clusters suggest a lot of competition among commercial species as well as between some non-commercial and commercial species. Second, some species occupy different guilds at different size classes, including Atlantic cod, spiny dogfish and winter skate, supporting the idea that different life stages of a species can function as different "ecological species". For example, Atlantic cod and spiny dogfish potentially compete only at the larger size classes when both become more piscivorous.
Note, however, that these clusters reflect only species sampled by the NEFSC, and are biased due to the under representation of non-commercial species.
PCA - Analysis
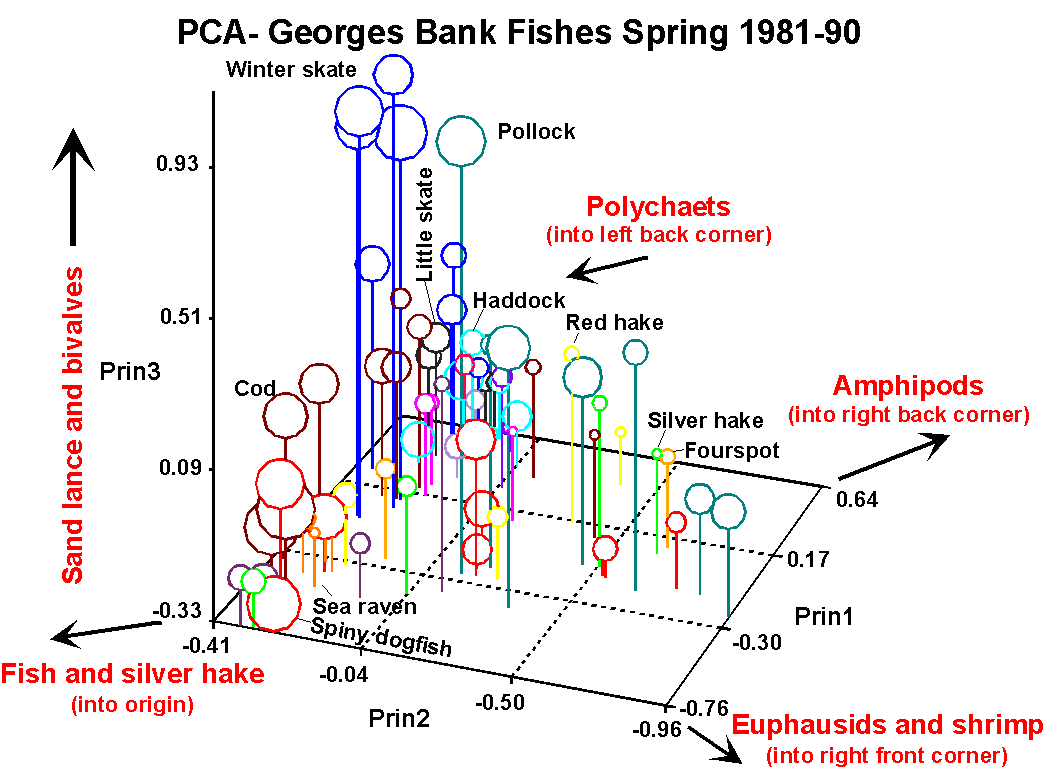
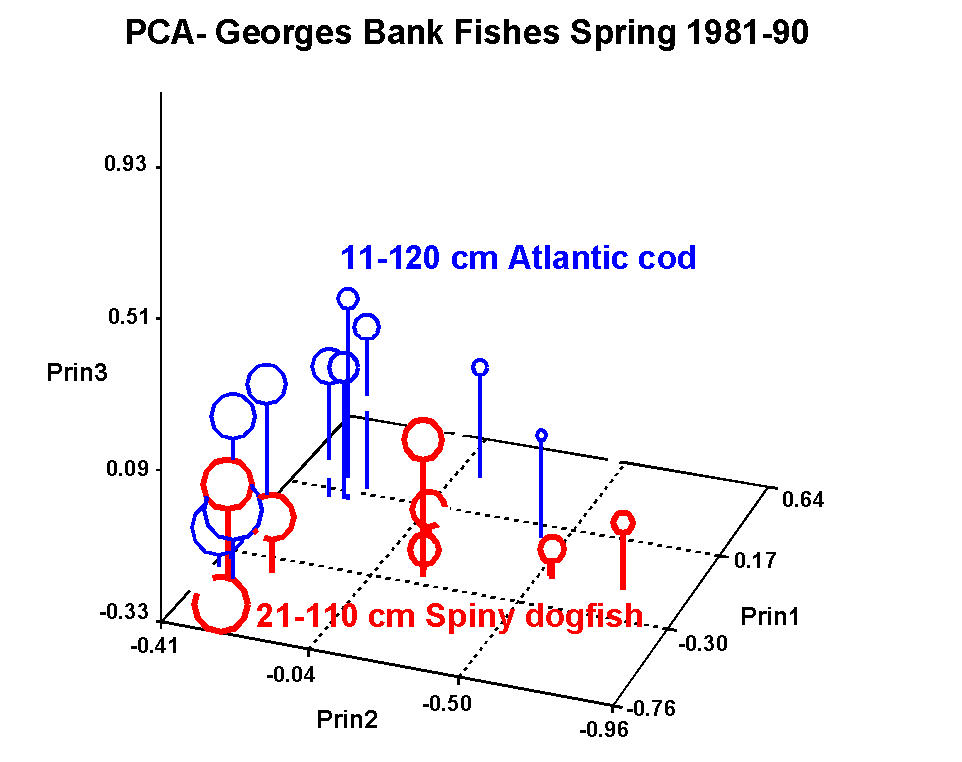
I input the same data used in the cluster analysis into PCA. Here I plot (Figure A) the first three principle components which account for 49% of the variance in the model. Each predator species is denoted by a different color and symbol sizes are proportional to the length class. The prey species most significantly correlated with the principle components are indicated in red. Species/stage clusters formed by the PCA are very similar to those formed by cluster analysis. However, the PCA more elegantly depicts the shifts in diet and species clusters with ontogeny (i.e., size). To illustrate this a simplified copy of Figure A is shown in Figure B in which all predator species except Atlantic cod and spiny dogfish have been removed for clarity. The two species move across PCA space in different patterns with increasing size, but the largest size classes appear to converge at the origin. Returning to Figure A, note that other species such as haddock and little skate move little across PCA space with all size classes clumping into the same region. In contrast, although Atlantic cod and spiny dogfish have similar piscivorous diets as adults, they both exhibit very different feeding patterns through ontogeny. Winter skate starts out feeding on small benthic crustaceans in competition with many species, but moves towards increased reliance on large mollusks, decapods and sand lance with size. These patterns suggest an intriguing way to classify species life history strategies by feeding patterns. Some species exhibit dramatic changes in feeding patterns and guild associations, while others exhibit little change.
A second intriguing pattern is the strong tendency for fishes of the same size to cluster together, underscoring the great importance of predator-prey size relationships.
A.
B.

Appendix A. Figure 1. Dendrogram of predators on Georges Bank during the spring 1981-90 based on diet.
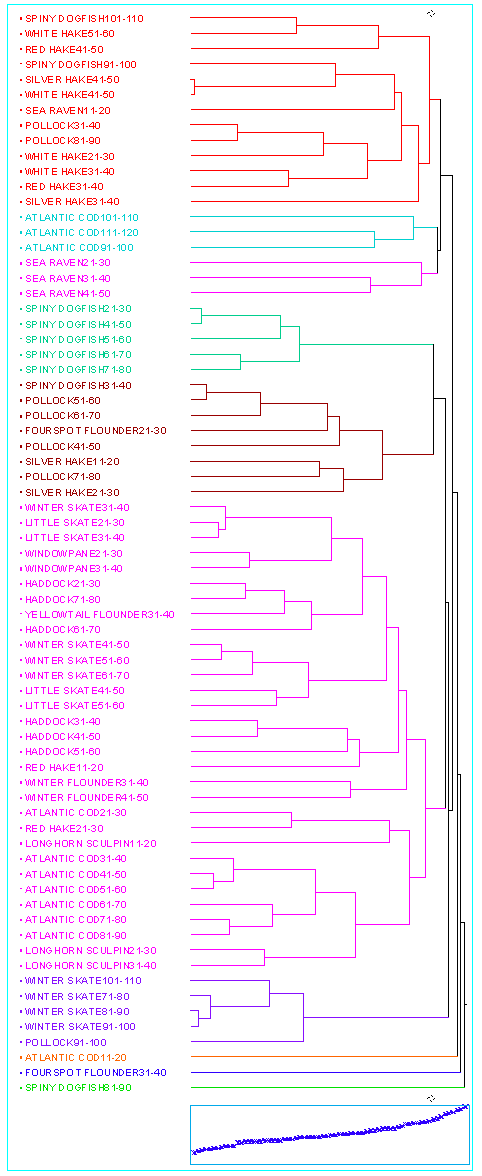
Figure 1. Full cluster dendrogram for 71 species-size class groups.
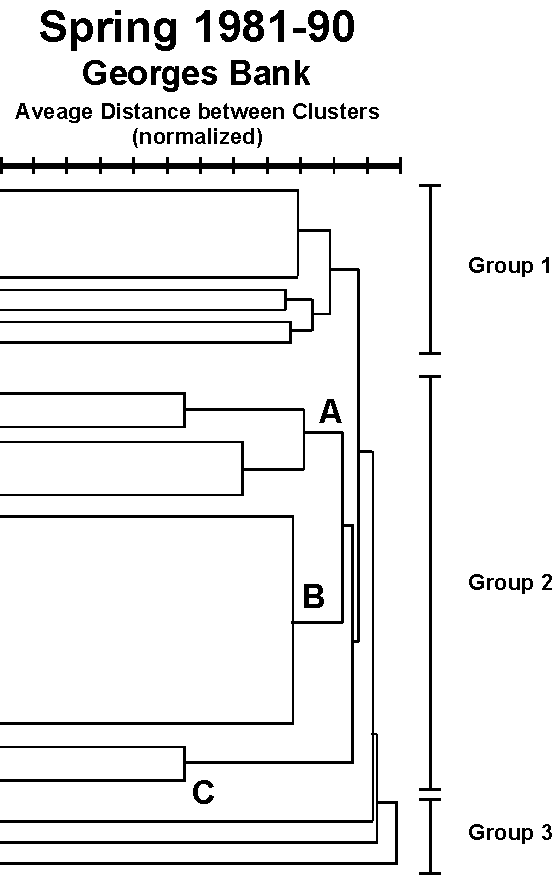
Figure 2. Schematic of simplified cluster dendrogram showing the five major groups.
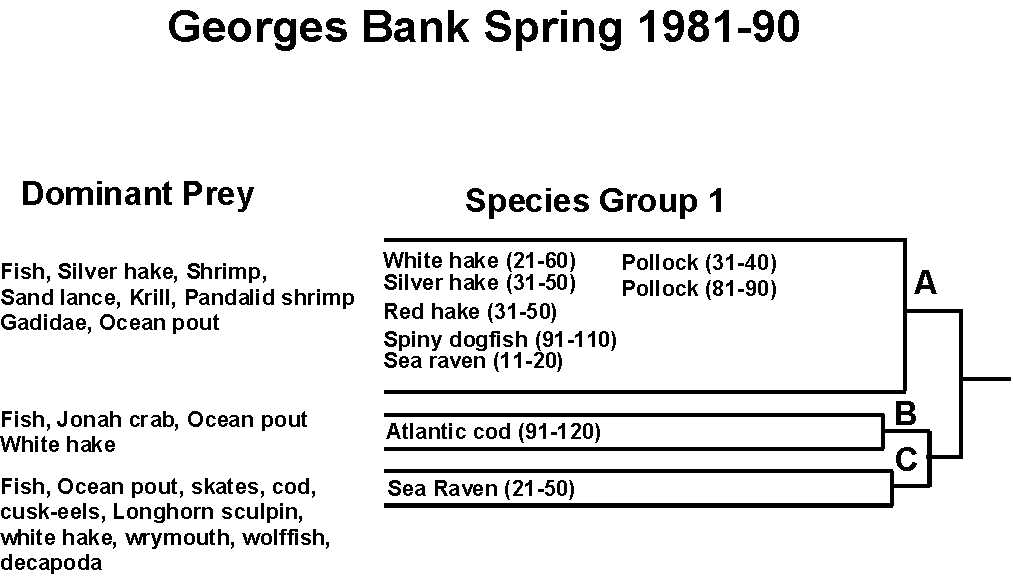
Figure 3. Detail of cluster group 1. The first group is composed of highly piscivorous species/size classes. Three subgroups can be identified: Subgroup A includes all four sizes of white hake, the two largest sizes of silver and red hakes, and spiny dogfish, the smallest sea raven and two sizes of pollock. These species are feeding primarily on small fishes and shrimps. Subgroup B is composed of the four largest sizes of Atlantic cod which feed on fish and large decapods. Subgroup C is composed of all but the smallest sea raven, which feed on large demersal/benthic fishes.
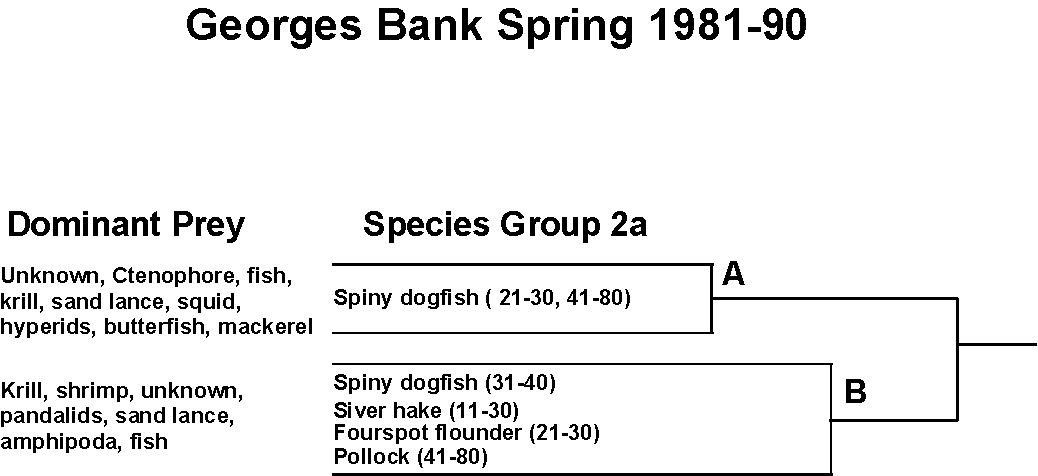
Figure 4. Detail of cluster group 2a. This group can be further divided into two groups. The first group contain all but one of the small-to-intermediate sizes of spiny dogfish which prey on pelagic zooplankton and fishes. The second group contains one size class of spiny dogfish, the smallest silver hake and fourspot flounder, and most pollock sizes. These fish feed primarily on small crustaceans and sand lance.
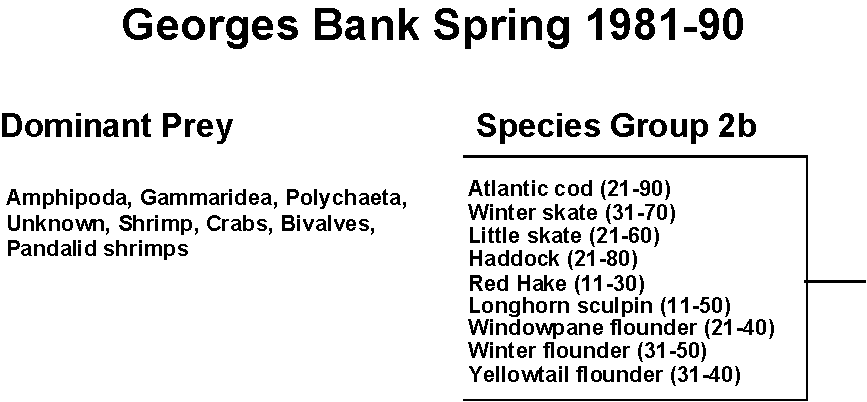
Figure 5. Detail of cluster group 2b. This is by far the largest group, and feeds on benthic invertebrates. It includes all small to mid-size cod, small sizes of red hake and winter skate, and all sizes of haddock, windowpane fl., Winter fl., yellowtail fl., little skate, and L.H. sculpin.

Figure 6. Detail of cluster group 2c. which is composed of the largest four size classes of winter skate, and the largest pollock, which feed on sand lance, polychaets, and mollusks.
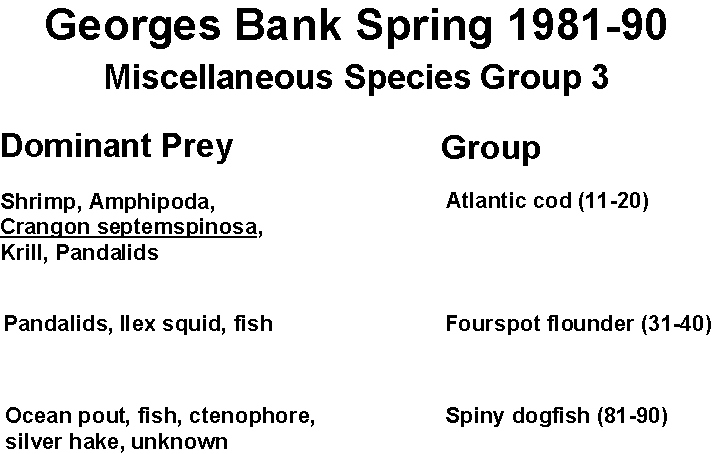
Figure 7. Miscellaneous group of single size classes of three species that cluster separately. These may be poorly classified or transitional stages.