Navigate toolbar: [ Diets | Photos | Estuarine | FADs | Soniferous | CV | Home Page ]
Summer flounder seminar
Seminar presented at the 12th Annual Meeting of the American Fisheries Society, Halifax, Nova Scotia, 21-25 August 1994.
Broad-scale distribution patterns of summer flounder and their prey based on bottom trawl surveys collected from 1973-92 between Cape Hatteras and the Scotian Shelf.
Rodney A. Rountree, Woods Hole Laboratory, Northeast Fishery Sciences Center, National Marine Fisheries Service, NOAA, 166 Water Street, Woods Hole, MA 02543, 508/548-5123(presenter)
Summer flounder exhibit strong ontogenetic differences in their seasonal distribution patterns. Generally, there is a pronounced tendency for increasingly extensive inshore-offshore seasonal migrations to occur with increasing fish size. The smallest size class (<21 cm TL) occur mainly between Cape Hatteras and Delaware Bay, and appear to remain resident inshore despite low water temperatures of 2-6 C. Fish, including Anchoa spp. and Ammodytes sp. were the most frequent prey. Frequent invertebrate prey include amphipods, mysids, Loligo sp. squid, Crangon septemspinosa, cancer crabs, portunid crabs. Preliminary comparisons of predator/prey distribution patterns suggest that ontogenetic differences in prey composition may be related both to seasonal/annual changes in prey distributions, and to ontogenetic movements of summer flounder across shelf habitats. Despite large changes in stock levels, and fishing pressures, distribution patterns appear to have remained stable over the last twenty years.
predator-prey distributions, ontogenetic habitat shifts, habitat response to fishing pressure.
Platform Presentation-Symposium: "Linkages between habitat level processes and population-community dynamics in marine systems". Non-student
Broad-scale distribution patterns of summer flounder and their prey based on bottom trawl surveys collected from 1973-92 between Cape Hatteras and the Scotian Shelf.
By
Rodney A. Rountree,
Woods Hole Laboratory, Northeast Fishery Sciences Center, NMFS, NOAA, 166 Water Street, Woods Hole, MA 02543
Introduction:
General distribution
The summer flounder, Paralichthyes dentatus occurs from Nova Scotia Canada to Florida. Its center of abundance lies in the Middle Atlantic Bight from Long Island Sound to Cape Hatteras, where it constitutes important commercial and recreational fisheries. As a result of the importance of the fishery through the 70's and subsequent rapid decline in the stocks in recent years, there has been a renewed interest in the ecology and population dynamics of the species. In the past five years significant advances in our understanding of the early life-history, and ecology of summer flounder have been made. Today I want to summarize some distributional and food habitats data, which has been compiled by the Resource Survey and Food Chain Dynamics Investigations of the Northeast Fishery Science Center. I will be examining the broad scale temporal and spatial patterns of summer flounder distribution. Although most of what I will be presenting is not new, this presentation constitutes the largest data set, and longest time series, yet compiled for summer flounder.
The Groundfish Resource Survey data set comprises bottom trawl data collected between Nova Scotia, Canada, and Cape Hatteras, NC during the spring and Fall since 1968.
[Click on thumbnails to view full figure]
Seasonal distribution
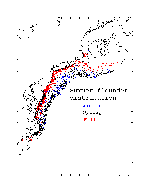
This is a plot of Resource Survey summer flounder catches by season, with winter catches in blue, spring in black and fall in red. I will be presenting a number of similar slides, so to orient you, this is the southern tip of Nova Scotia, Gulf of Maine, Cape Cod, Georges Bank, Long Island, New Jersey, Delaware Bay, Chesapeake Bay, the Pamlico-albermarle Sound system of North Carolina, and Cape Hatteras. The 100-m depth contour is shown here.
In the fall, summer flounder are concentrated inshore and in coastal estuaries all along the coast. Some concentrations also occur on Georges Bank. During the winter and spring fish are most concentrated along the shelf break, though they also occur all across the shelf and in low numbers inshore. There is a marked tendency for greater use of the shelf and inshore areas south of New Jersey. In the past this pattern has been thought to result from non-synoptic sampling. Generally it takes eight weeks to survey the entire regional. The survey is accomplished in four two-week cruises. The first leg generally starts offshore somewhere around southern New Jersey and returns northward along the inshore. The second leg continues where the first left off in another large loop. The third leg usually completes George Bank, and the fourth the Gulf of Maine and Cape cod-Bay. The non-synoptic sampling, therefore, might cause an apparent latitudinal variation in summer flounder seasonal distribution. However, since winter surveys reveal a similar distribution as that observed in the spring, it is apparent that this bias is not great, and the latitudinal variation in seasonal distributions is real.
As you can see, then, summer flounder exhibit a pronounced seasonal migration pattern. Generally, they move inshore and into estuaries in the late spring and summer, and move back offshore in the late fall and winter. Spawning is thought to occur during the fall/winter offshore migration.
Winter temperatures
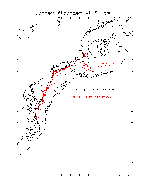
This figure shows the winter temperature and catch distribution during 1992. Summer flounder were captured in water temperatures between 4-14 C, however abundances were greatest near the shelf break at temperatures between 8-14 C. In other years some summer flounder were captured inshore at temperatures as low as 2 C. Note, the cold inshore water extends down the coast as far as Chesapeake Bay and Cape Hatteras.
Spring Temperatures
There is a similar distribution of water temperature and summer flounder catches during the spring. Note however, the beginning retreat of the coldest inshore waters. Also note the sharp demarcation of cold and warm water masses at Cape Hatteras. Notice that summer flounder are absent from Georges Bank despite their presence in very cold water inshore along southern New England. In general summer flounder are distributed across a very wide range of temperatures.
Fall temperatures
During the fall, fish are inshore in water temperatures of 16-30C. Again, note the very sharp change in water temperatures at Cape Hatteras. Notice that in this year summer flounder distribution onto Georges Bank is restricted to warm water. Several studies have previously suggested that summer flounder distribution, particularly its occurrence on Georges Bank, is controlled by annual variation in water temperatures. However, after examining over 25 years of data, I can report no consistent correlation of distribution and water temperatures. There is, however, a weak pattern of a response of the northern distribution of summer flounder to stock abundances, with their distribution tending to extend onto Georges Banks during years of relatively high abundance.
<21 cm distribution
Ontogenetic patterns
I examined the distribution patterns by 10-cm size class.
This is one of the more interesting patterns I observed in the survey data. Fish of 14-20 cm occur in low numbers on the shelf, and are mainly restricted to, the Chesapeake region. Note that they show no seasonal movements, other than emigration from the estuaries. Limited data from winter surveys confirms this. These individuals are present inshore despite temperatures as low as 2-6C. Indeed there have been reports of at least some overwintering within estuaries of North Carolina of YOY fish.
Implications for stock structure
Stock Identification of summer flounder is not clear. Evidence for separate Mid-Atlantic and South Atlantic Bight stocks has been presented by several studies. Other evidence suggests an intermediate "trans-Hatteras stock" which summers along the Maryland-Virginia coasts, and overwinters off Cape Hatteras.
21-30 cm distribution
Primarily YOY
More extensive migrations onto the shelf Extend farther north
Latitude variation
Implications for spawning (perhaps offshore migrations begin at onset of maturity?)
Since there is little growth over the winter months, there is some overlap with yearling fishes. Some of these individuals have reached sexual maturity.
31-40 cm distribution
Clear demarcation between spring and fall
More northerly distribution, especially in the fall Latitude variation increasing
Fully mature size class
Slide 8. 
41-50 cm distribution
Very strong seasonal pattern
In fall most southern limit is about Chesapeake Bay Clear northern shift
Implications for spawning season.
>50 cm distribution
Similar to Slide 8, but even more pronounced
Past studies mention movement north with size, but do not recognize the southern seasonal migration of large fish apparent from these distribution patterns. Relationship to temperature is unclear at this time.
Summer flounder food
Food habits of over 2,000 summer flounder collected during Resource Survey cruises have been examined. During 1977-80 samples were preserved at sea and worked up in laboratory, while from 1981 to present samples are worked up at sea. In both cases Fish, Cephalopods, and Crustaceans dominate the catches.
Many more fish & crustacea species 81-90
Diet change with size
Decrease in importance of crustacea with size Increase in importance of fish/cephalopoda with size 20 cm fish Crangon, Cancer irroratus 30 cm Neomysis, Crangon, Cancer irroratus, Gammarid amphipods, Anchoa sp.,
40 cm Ammodytes, Cephalopoda, Neomysis, Anchoa
50 cm Loligo, Ammodytes, Ovalipes, Peprilus, Anchoa, 60 cm Loligo, Ammodytes, Anchoa
Top prey distributions
species distributions, mostly inshore
Fish Ammodytes dubius, crustaceans: Neomysis americans,
Cancer irroratus
Secondary prey distributions
Mostly inshore,
Fish Anchoa mitchilli
Crustaceans: Crangon septemspinosa, Ovalipes ocellatus
Other prey
Cephalopoda, Loligo sp.
Conclusions
Despite large changes in stock levels, and fishing pressures, distribution patterns appear to have remained relatively stable over the last 20 years. However, the northern distribution during the spring does show a weak response to population size. The relationship of water temperature to the northern limit and migration patterns appears weak over this period.
Summer flounder exhibit strong ontogenetic differences in their seasonal distribution patterns. Generally, there is a pronounced tendency for increasingly extensive inshore-offshore seasonal migrations to occur with increasing fish size. The smallest size class (<21 cm TL) occur mainly between Cape Hatteras and Delaware Bay, and appear to remain resident inshore despite low water temperatures of 26 C.
Preliminary comparisons of predator/prey distribution patterns suggest that ontogenetic differences in prey composition may be related both to seasonal/annual changes in prey distributions, and to ontogenetic movements of summer flounder across shelf habitats.
During the groundfish surveys, many species have been subsampled for age-growth and maturity information, as well as for food habits information. We are currently undergoing extensive quality control efforts in order to standardize these data sets, and to build an integrated relational data set. We are expecting to be complete the first step in this process, that of integrating all Food habits and groundfish catch data from 1973-present this fall. I hope my presentation today illustrates the future utility of the linked food habits and groundfish survey data sets.
This page was last modified on July 20, 2001
Copyright © 1999 by Rodney Rountree. All rights reserved
Navigate to main diet pages: [ Parent | Summary | Fluke | GMDiet | GMGuild | Goosefish | Guild | Ontogenetic | Prey size | Structure ]
Navigate to main pages: [ Diets | Photos | Estuarine | FADs | Soniferous | CV | Home Page ]