Navigate toolbar: [ Diets | Photos | Estuarine | FADs | Soniferous | CV | Home Page ]
Data analysis for ontogenetic patterns in predator types
Rountree, R.A., N.J. McHugh, W.L. Michaels, C.G. Milliken, and R.M. Yetter. Onset of piscivory and characterization of feeding types of Northwest Atlantic shelf fishes.
This study utilizes the extensive food habits data set maintained by the NMFS to characterize the diets of 59 species of fish and 2 squids into distinct feeding types (i.e., piscivorus, molluscivorus, etc.). It also examines changes in feeding type among 10 cm, or 20 of maximum size, size classes for each species, and classifies feeding types by the pattern of shifts through ontogeny (e.g., a primary piscivore relies primarily on fish prey through all of its sampled size classes). Many species were found to shift from primarily preying on arthropods to predation on fishes at larger sizes. Some species, however shifted to predation on echinoderms or annelids. None were observed to prey exclusively on mollusks at any stage. The paper explores implication of such major prey shifts, and of the timing of these shifts.
We emphasize the importance of regression methods in trophic studies. Attempts to compare spatial or temporal patterns in food habits of fishes are often highly biased when data are pooled over all size classes prior to the comparison. Even small differences in the size distribution of samples among the comparison groups can lead to erroneous inferences of group differences due to extreme ontogenetic diet changes THAT ARE THE RULE WITH FISHES. The common practice of lumping fish into juvenile and adults is particularly is not sufficient to alleviate this problem, nor is standardizing by body weight.
The keystone figures for this paper are presented below:
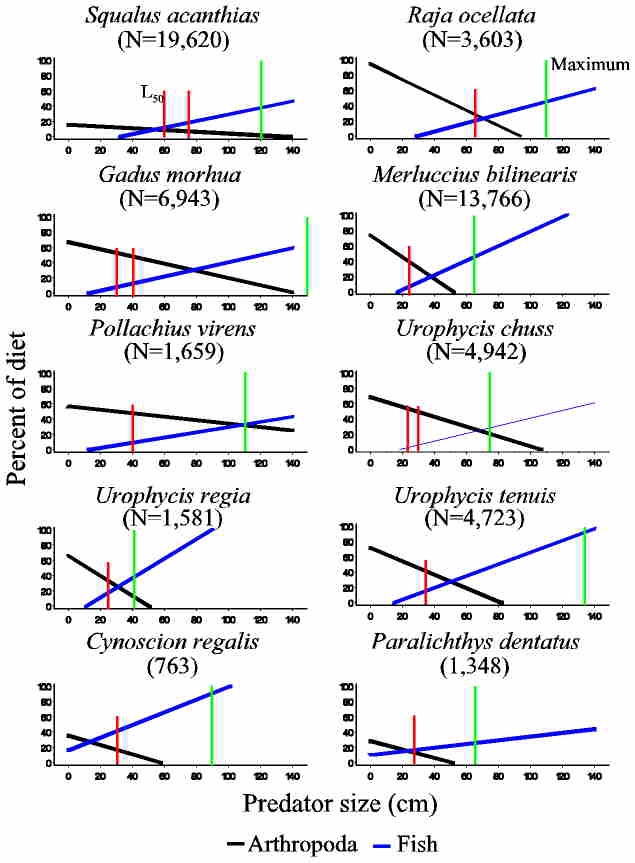
Figure 1. A number of fishes start out feeding on one prey type (e.g. arthropods or polychaets) and switch to fishes with increasing size. The relationships are strongly linear and are inversely proportional. We suggest that these relationships can be used to compare populations under different treatment groups. Further, the intersection of the two regressions can be used to define the point of switching from one food type to the other. The switch point appears to coincide with the onset of maturity (vertical red lines) for several species. Vertical green lines are the reported maximum size for the species. For clarity data points are not drawn.
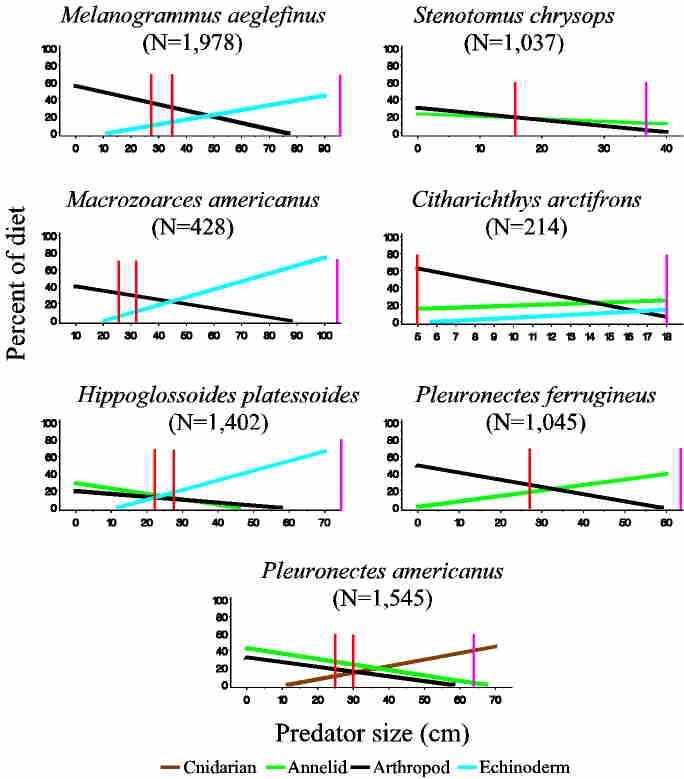
Figure 2. Similar patterns are illustrated for species that switch to Echinoderms, Annelids or Cnidarians.
Tables and illustrations from ASIH'98 presentation in Guelph. Actual figures and tables for manuscript will be posted later.
[Click on thumbnails to view full sized figure]
 Table 1. Objectives.
 Table 2. Sample sizes.
 Table 3. Prey categories used in analysis.
 Table 4. All predators with Annelids accounting for at least 15 of the diet.
 Table 5. All predators with Arthropods accounting for at least 15 of the diet.
 Table 6. All predators with Mollusks accounting for at least 15 of the diet.
 Table 7. All predators with Fish accounting for at least 15 of the diet.
 Table 8. All predators of other prey groups which account for least 15 of the diet.
 Table 9. Predator types: primary piscivore.
 Table 10. Predator types: primary Arthropoda predators.
 Table 11. Predator types: Other primary predators.
 Table 12. Predators types: Omnivores.
 Table 13. Sample sizes for ontogenetic diet shift analysis.
 Table 14. Significant linear patterns in prey type shifts with ontogeny.
 Figure 1. Profile of prey type changes with ontogeny (size) for smooth dogfish, Mustelus canis. Example, primary arthropod predator.
 Figure 2. Profile of prey type changes with ontogeny (size) for Atlantic goosefish, Lophius americanus. Example, primary piscivore.
 Figure 3. Profile of prey type changes with ontogeny (size) for bluefish, Pomatomus saltatrix. Example, primary piscivore.
 Figure 4. Profile of prey type changes with ontogeny (size) for American Plaice, Hippoglossoides platessoides. Example primary echinovore.
 Figure 5. Comparison of prey type changes with ontogeny (size) for winter skate, Raja ocellata, Atlantic cod, Gadus morhua, pollock, Pollachius virens, and summer flounder, Paralichthys dentatus. Examples of secondary piscivores. Graphs of ontogenetic changes in prey types for other species can be viewed under the Diets section of this web page or click here to go directly there.
 Figure 6. The following figures illustrate the results from a Correspondence analysis of predator diets by length classes, where predator lengths were grouped into 5-20 length classes based on a percentage of maximum size (actually the 99th percentile based on all fish measured by NEFSC during 1973-97 bottom trawl surveys). Correspondence analysis plot of dimension 1 versus dimension 2.
 Figure 7. Same graph showing only the prey type distributions.
 Figure 8. Same graph showing mean canonical scores over all length classes, for predators which exhibited little or no variation.
 Figure 9. Same graph showing changes in canonical scores among size classes for each predator, and relationship among predators.
 Figure 10. Schematic illustration of inferred predator feeding types based on ontogenetic patterns.
This page was last modified on July 20, 2001
Copyright © 1999 by Rodney Rountree. All rights reserved
Navigate to main diet pages: [ Parent | Summary | Fluke | GMDiet | GMGuild | Goosefish | Guild | Ontogenetic | Prey size | Structure ]
Navigate to main pages: [ Diets | Photos | Estuarine | FADs | Soniferous | CV | Home Page ]